Ward on Orisha: Three Binaries on One Machine
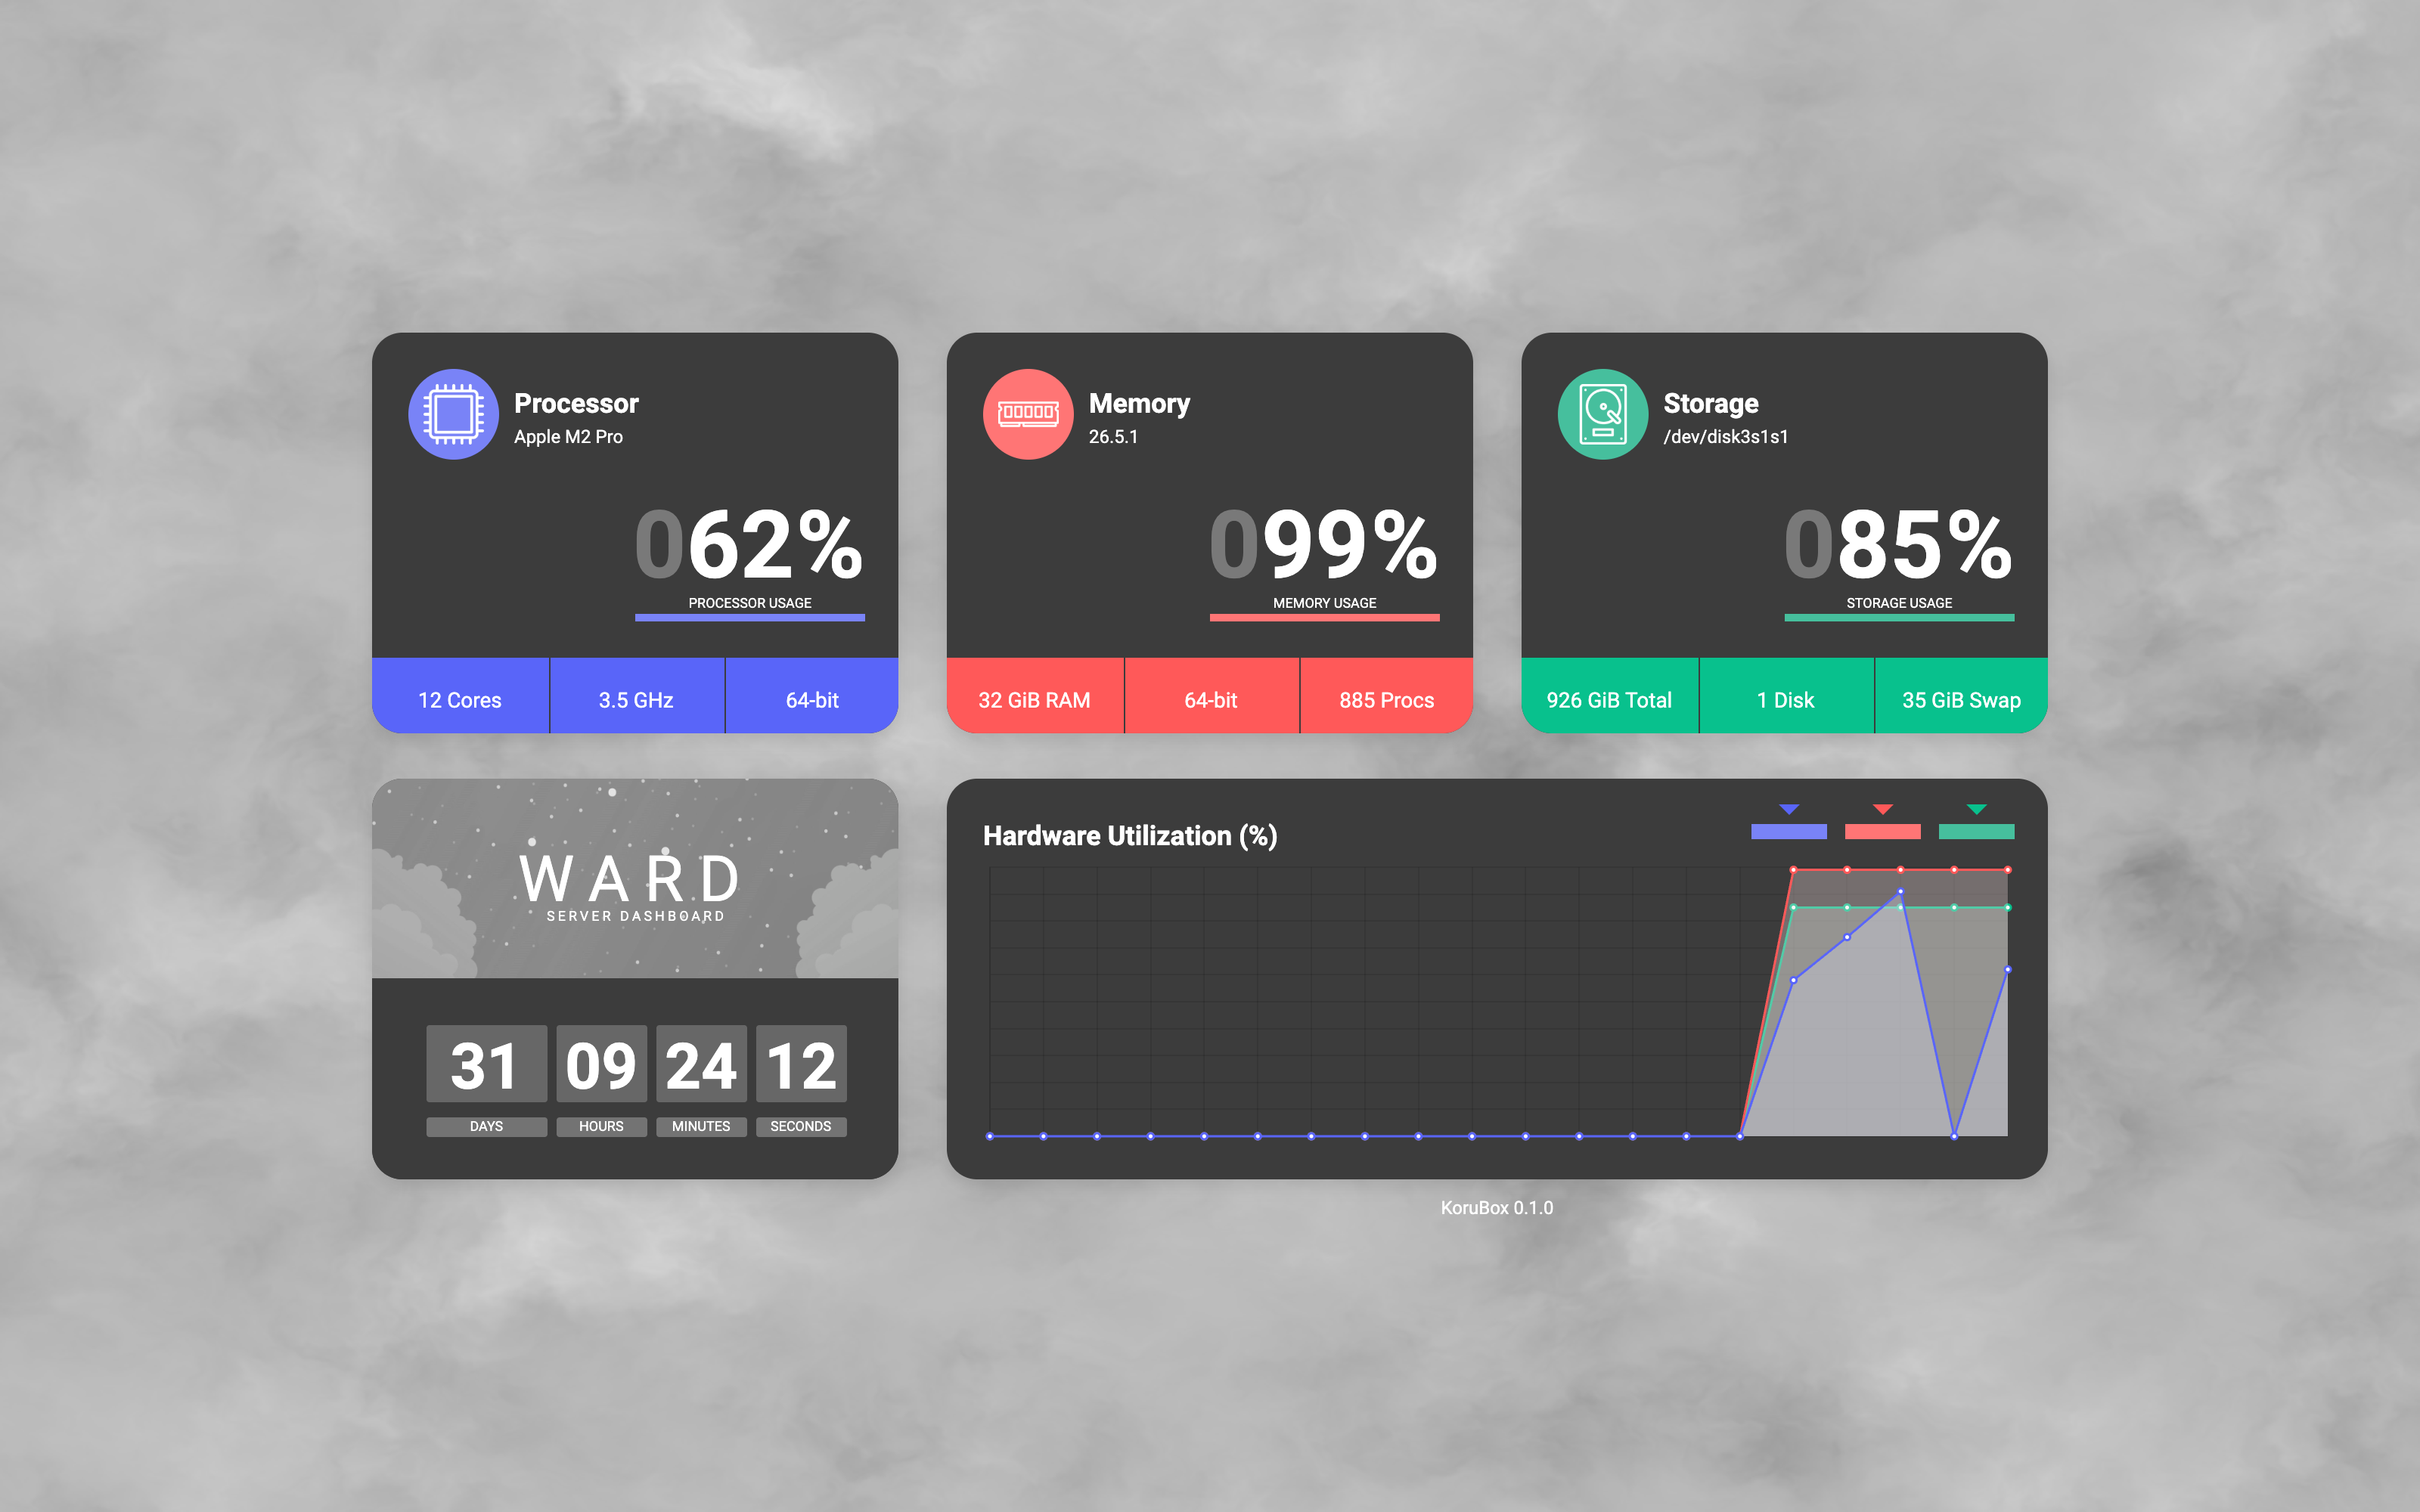
Ward is a server dashboard. You open a page, you see processor, memory, storage, uptime. Java Spring first, then a public Rust rewrite. The Koru program is served by Orisha.
orisha:static(name: "site", root: "public")

orisha:handler = orisha:router(req)
! [GET /api/usage] |> usage(): u |> std/fmt:ln("{\"processor\":{{ u.processor:d }},\"ram\":{{ u.ram:d }},\"storage\":{{ u.storage:d }}}"): l -> { status: 200, body: l.text, content_type: "application/json" }
That is not a mock. usage is a tor whose Zig body reads the machine. The JSON is fmt:ln over that record. CSS, JS, images, fonts go through orisha:static / orisha:static-router. After setup, GET / is HTML from fmt.blk. orisha:serve is the socket. Koru and ward-rs expose GET /api/uptime. Java 1.8.8 does not — its jar has IndexController, InfoController, UsageController, SetupController, ErrorController. javap on those classes maps /api/usage and /api/info. There is no UptimeController. Uptime is a field on Java’s /api/info.
The pages are bigger than a line
fmt:ln writes a thread-local buffer. A dashboard is not that buffer. fmt.blk allocates; bind the string with : f. The slice carries allocated! so something has to free it — std/io:free at a top-level site, orisha:release-body when the response still holds the bytes.
The pin for the allocating form is ordinary Koru:
import std/fmt
import std/io

const {
    name: "World"
    count: 42
}

std/fmt:fmt.blk {
    Hello, {{ name:s }}! The answer is {{ count:d }}.
}: f |> std/io:print.ln("{{ f:s }}")
A router arm that prints can free in the arm. A router arm that returns the slice cannot — the Response still holds it. That flag is how serve and answer share one discharge.
Setup is a write
POST /api/setup parses a JSON body and writes setup.ini. std/fs already streamed; | written / | failed is the other half. No silent cap. The call in the router is parse-setup(req.body) — the last path segment puns to the field body.
import std/io
import std/fs

std/fs:write(path: "written.txt", content: "alpha\nbeta\n")
| written |> std/fs:read-lines(path: "written.txt")
    ! line l |> std/io:print.ln("{{ l:s }}")
    | done n |> std/io:print.ln("{{ n:d }} lines")
    | failed e |> std/io:print.ln("FAILED: {{ e:s }}")
| failed e |> std/io:print.ln("FAILED: {{ e:s }}")
The dashboard HTML sits under | cfg at one indent and the block text at another. That is a legal source block. A bind named c in a router arm is a legal bind — Orisha’s libc alias is libc, so the local is not a Zig 0.15 shadow.
Three processes, one machine
This machine, one pass: Koru a.out pid 69863 on :4000, ward-rs pid 35930 on :4001, java -jar ward-run.jar pid 56728 on :4002. Disk is wc -c. Charged RAM is footprint -p (phys_footprint / phys_footprint_peak). ps RSS is a different column. Request clocks are curl -w time_total to 127.0.0.1 — one GET’s wall clock, not wrk, not a remote round trip.
The file gh shipped as ward-1.8.8.jar does not load OSHI on this Darwin. Nested BOOT-INF/lib/jna-5.6.0.jar is 1509440 bytes; a probe of that JNA with the jar’s OSHI dies:
UnsatisfiedLinkError … fat file, but missing compatible architecture (have 'i386,x86_64', need 'arm64e' or 'arm64e.v1' or 'arm64' or 'arm64')
The Java process in this pass is ward-run.jar (wc -c 29256046). Nested files are still named jna-5.6.0.jar / jna-platform-5.6.0.jar; their stored sizes are 1878533 and 1369287, matching jna-5.14.0.jar and jna-platform-5.14.0.jar on disk. Ward classes are the 1.8.8 ones. After that swap, GET / is <title>JavaBox</title> at bytes=15511.
footprint -p is Darwin’s charge for dirty anonymous pages, not virtual size, not shared library text. Koru a.out [69863]: Footprint: 1840 KB — dirty includes 560 KB MALLOC_SMALL, 304 KB page table, 288 KB MALLOC metadata, 256 KB stack. Auxiliary: phys_footprint: 1856 KB, phys_footprint_peak: 1856 KB. Rust ward [35930]: Footprint: 9648 KB; phys_footprint: 9680 KB, phys_footprint_peak: 9824 KB. Java java [56728]: Footprint: 163 MB — dirty includes 113 MB untagged (VM_ALLOCATE) and 31 MB MALLOC_SMALL; phys_footprint: 163 MB, phys_footprint_peak: 262 MB. That Java row is a JVM. Koru and Rust are native binaries. The columns are comparable as instruments, not as “the same program’s RAM.”
wc -c | phys_footprint | phys_footprint_peak | ps RSS | threads | |
|---|---|---|---|---|---|
Koru a.out | 3724600 | 1856 KB | 1856 KB | 1280 | 13 |
Rust ward | 7137776 | 9680 KB | 9824 KB | 8048 | 14 |
Java ward-1.8.8.jar | 30255776 | 163 MB | 262 MB | 32576 | 48 |
Java disk is the shipped jar. The process is ward-run.jar. ps RSS on that JVM is 32576; phys_footprint is 163 MB. They disagree because they measure different things.
First GET, curl -w time_total:
/ | /api/usage | /api/info | /api/uptime | |
|---|---|---|---|---|
| Koru | http=200 bytes=6563 0.000445 KoruBox | http=200 bytes=38 0.000309 JSON | http=200 bytes=336 0.000312 JSON | http=200 bytes=56 0.000303 JSON |
| Rust | http=200 bytes=5036 0.000586 Welcome | http=200 bytes=38 0.035677 JSON | http=200 bytes=346 0.000400 JSON | http=200 bytes=56 0.000270 JSON |
| Java | http=200 bytes=15511 0.193372 JavaBox | http=200 bytes=38 1.049289 JSON | http=200 bytes=488 0.215410 JSON | no such route; http=404 bytes=2012 title 404 |
Five more GET /api/usage, all http=200 bytes=38 JSON: Koru 0.000363 0.000481 0.000660 0.000659 0.000512. Rust 0.031646 0.042078 0.037757 0.045820 0.037569. Java 1.026781 1.038818 1.037514 1.042002 1.039153. UsageService.getProcessor loads long 1000l and calls oshi.util.Util.sleep; that method’s string is Sleeping for {} ms and it calls Thread.sleep. That sleep is in Java’s usage clock. Five more GET /: Koru 0.000745 0.000485 0.000454 0.000526 0.000473 (bytes=6563). Rust 0.000590 0.000381 0.000370 0.000369 0.000371 (bytes=5036). Java 0.211543 0.208336 0.206471 0.161560 0.153119 (bytes=15511, JavaBox).
The listen line is a tor and a pun:
listen-port(): port |> orisha:serve(port)
| shutdown s |> std/io:print.ln(s)
| failed f |> std/io:print.ln(f)--port, WARD_PORT, then setup.ini. The form interpolates that same port. Mach HOST_CPU_LOAD_INFO is the Darwin load ticks; kern.cp_time is not an oid on this Darwin.
A dashboard is a small HTTP program. This one happens to be Koru, and the server is Orisha.